
*How we built two production-grade React UIs on top of existing FastAPI backends — matching a shared design system, wiring up React Query, and integrating Recharts for real-time engineering visualization.
Two mature Python backends had been sitting in our engineering stack:
- Fatigue Analysis Engine — DNV-RP-C203 fatigue calculations, rainflow counting, S-N curves, RUL estimation
- MCID (Marine Corrosion Intelligence Database) — ETL pipeline for hull inspection data, thickness trends, predictive maintenance
Both had Streamlit dashboards and CLI tools, but no modern web UI. We built two React 19 frontends from scratch, integrating with the existing FastAPI backends, and deployed them as systemd services alongside the Python APIs.
The Design System: FlexPipe as Reference
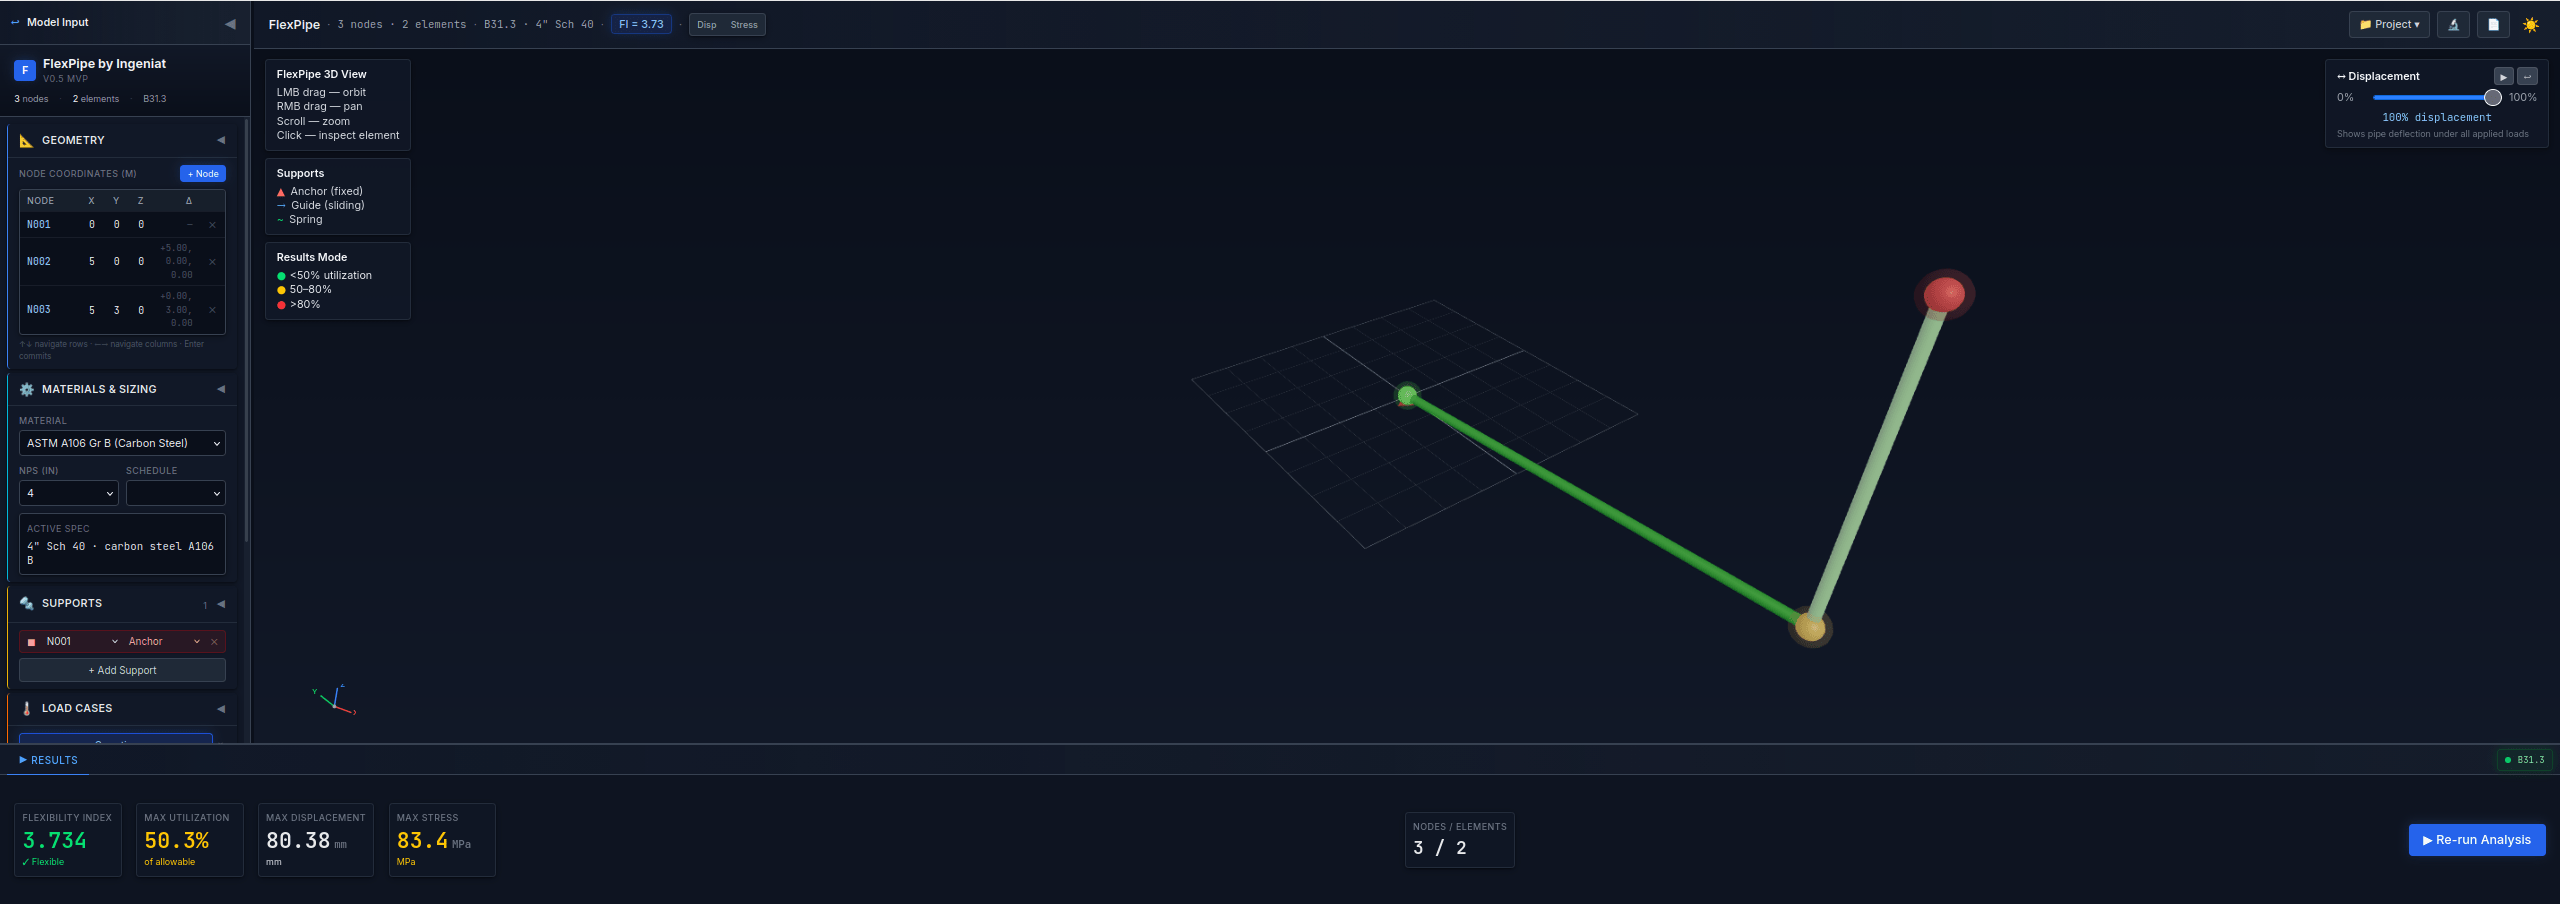
Both frontends follow the FlexPipe design system: React 19, TypeScript, Tailwind CSS v4 with a custom --color-surface-* and --color-brand-* token palette, Inter + JetBrains Mono fonts, dark/light theme toggle, and glow shadows for accent elements.
Rather than invent conventions, we audited the FlexPipe UI at new_apps/flexpipe and reproduced its token set, component patterns, and layout conventions in both new projects. The index.css for each app defines the full theme:
@theme {
  --color-surface-50: #f8fafc;
  --color-surface-900: #0f1419;
  --color-surface-950: #080b10;
  --color-brand-500: #3b82f6;
  --color-brand-900: #1e3a5f;
  --shadow-glow-blue: 0 0 20px rgba(59, 130, 246, 0.3);
  --shadow-glow-green: 0 0 12px rgba(34, 197, 94, 0.4);
}
Shared UI primitives (StatCard, Badge, SectionCard, LoadingSpinner, EmptyState) live in src/components/ui/index.tsx and are reused verbatim across both apps.
App 1: Fatigue Analysis Engine
Stack: React 19 · TypeScript · TanStack React Query · Recharts · Tailwind v4 Backend: FastAPI + uvicorn (port 8201) · DNV-RP-C203 S-N curves · Palmgren-Miner damage Frontend: Vite dev server (port 5201) with /api → :8201 proxy
Pages
| Page | What it does |
|---|---|
| Dashboard | KPI stats, S-N curve quick reference, Palmgren-Miner formula, environmental factors, API endpoint reference |
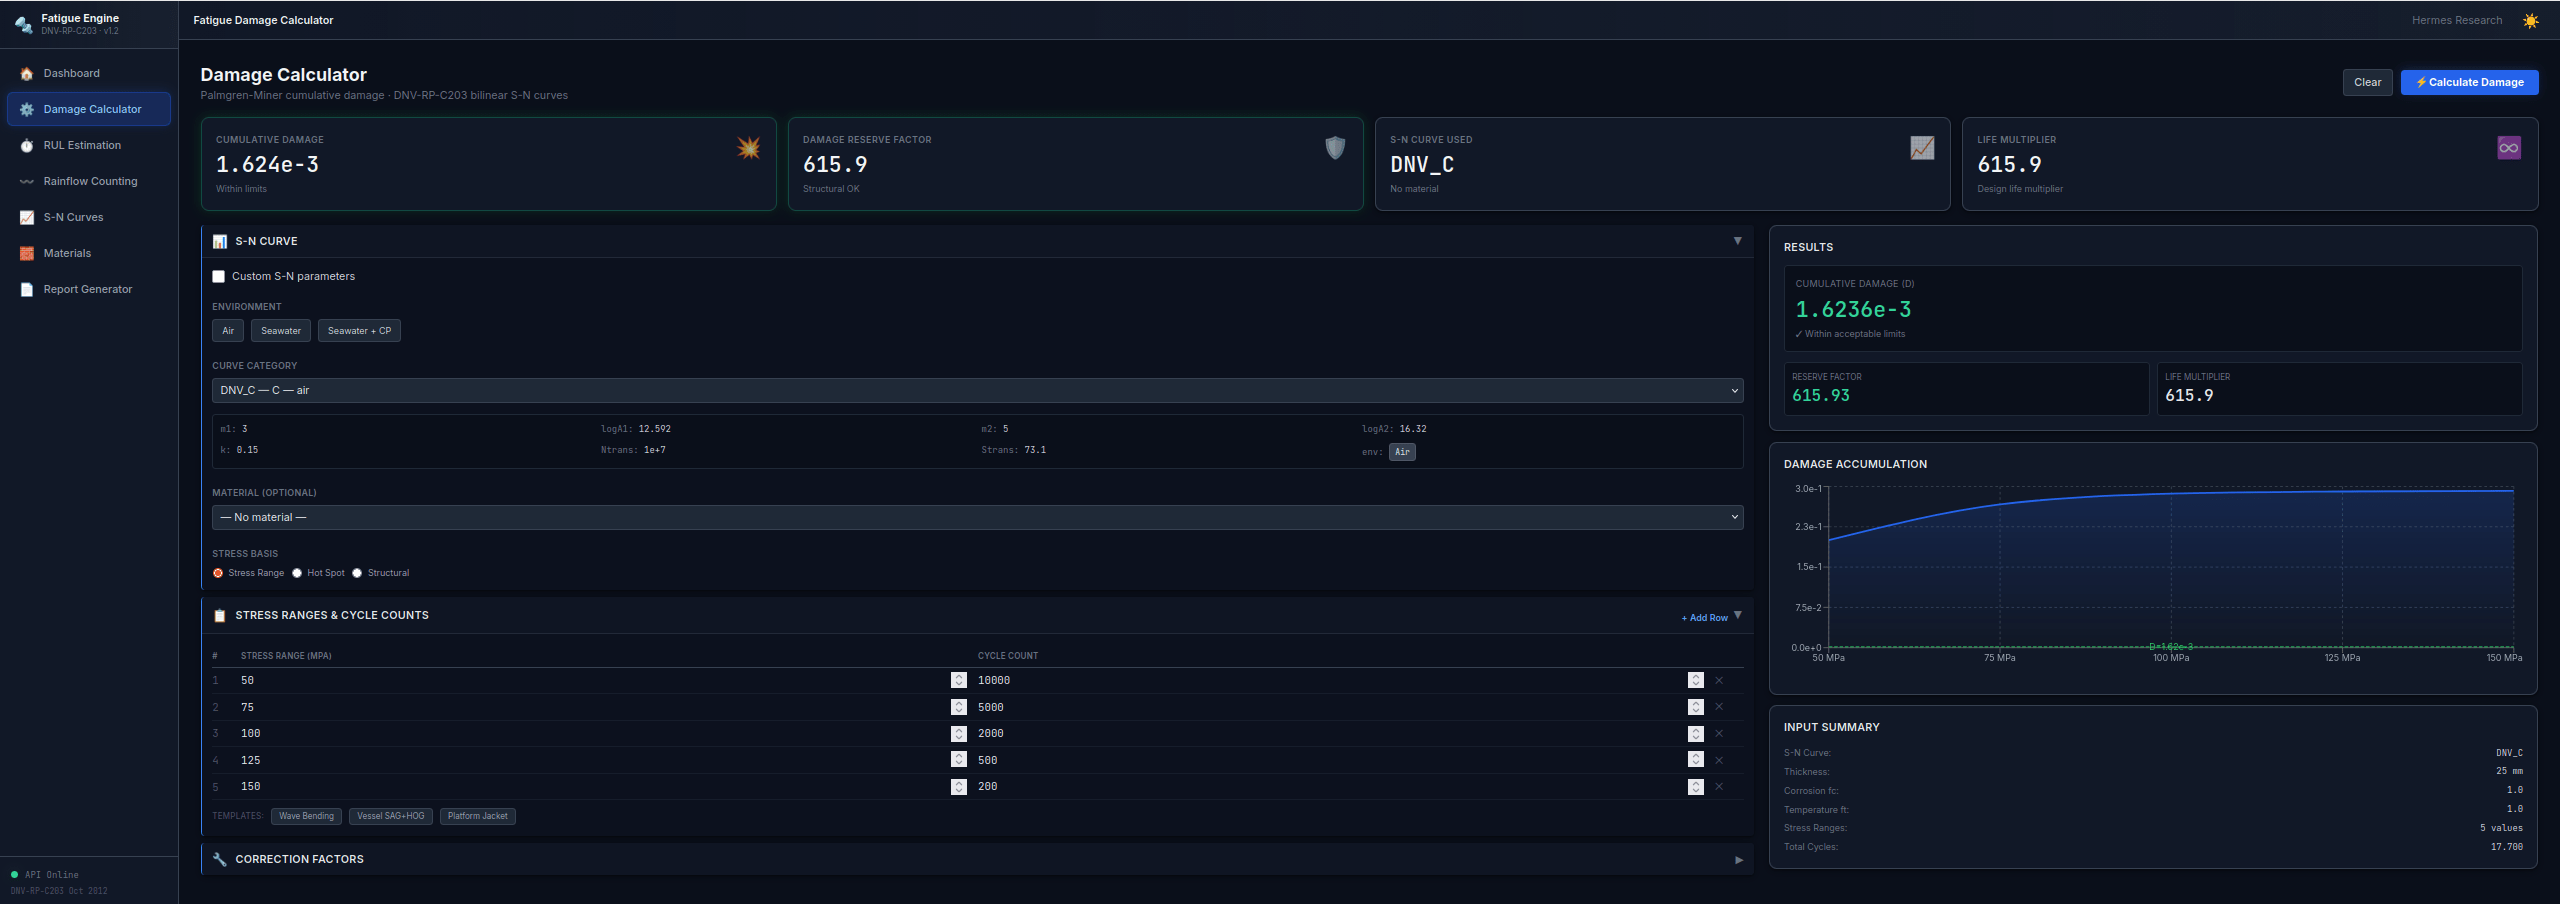
| Damage Calculator | Full form: S-N curve selector with env/category filters, custom parameters toggle, editable stress/cycle table, correction factors, damage accumulation chart, quick templates (Wave Bending, Vessel SAG+HOG, Platform Jacket) |
| RUL Estimation | Damage params + confidence intervals, RUL timeline chart with confidence bands |
| Rainflow Counting | Synthetic time-series generation + paste mode, rainflow results table (stress_range, mean_stress, count), histogram, scatter plot |
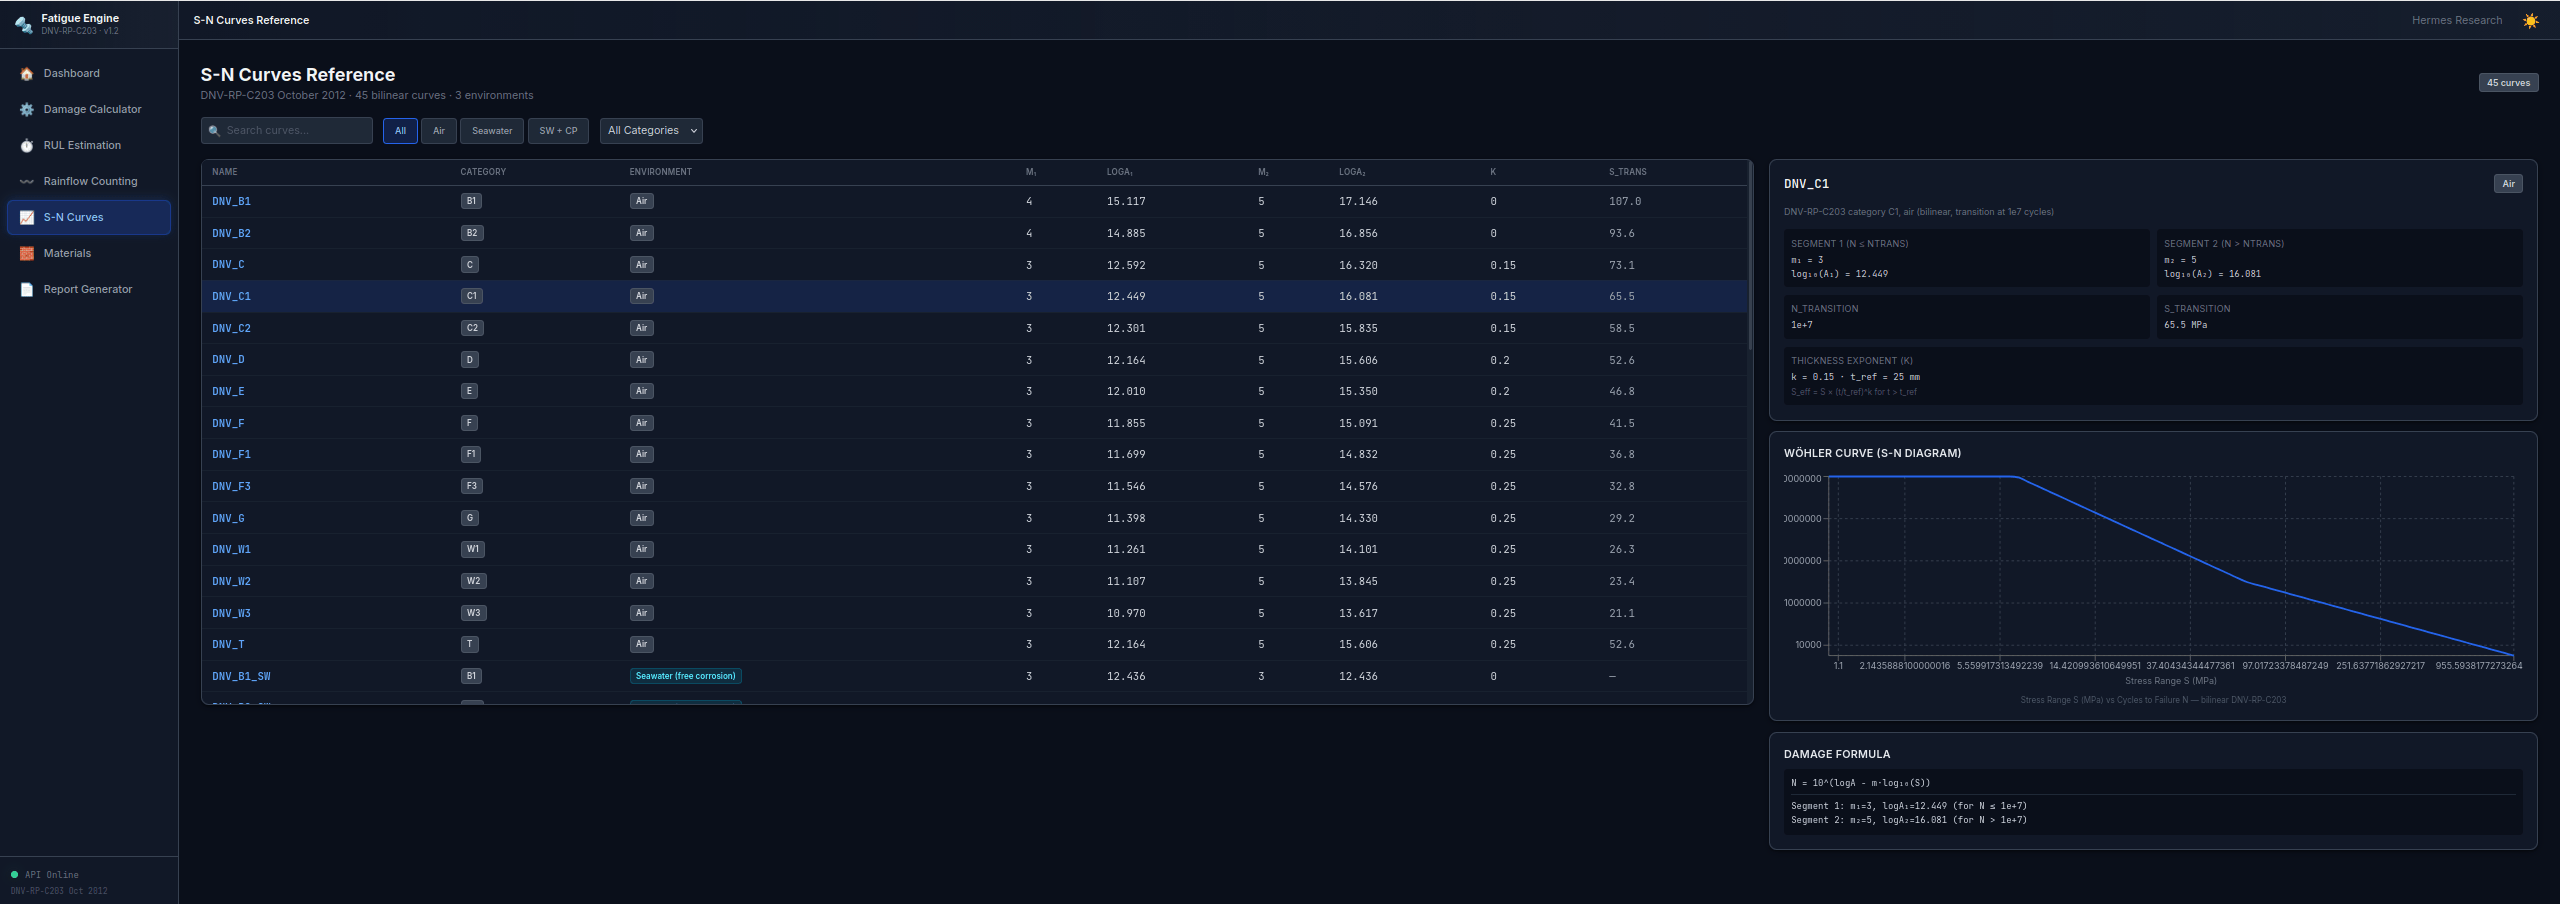
| S-N Curves | Full table of all 45 curves, env/category/search filters, selected curve detail + Wöhler plot |
| Materials | Searchable table with S-N curve mapping, yield/UTS/corrosion rate columns |
| Report Generator | Component info, analysis params, results, recommendations, Markdown/PDF format toggle, preview |
Key Technical Decisions
Rainflow counting uses the ASTM E1049-85 four-point algorithm implemented in rainflow.py. The API accepts a time-series and returns cycle tuples with stress_range, mean_stress, and count — the frontend visualizes these as a histogram and scatter plot.
Quick templates in the Damage Calculator pre-fill stress ranges and cycle counts for common marine loading scenarios, letting engineers jump-start an analysis without entering data manually.
S-N curves are bilinear (two-segment Wöhler curves) defined by m1, loga1, n_transition, m2, loga2 — the frontend plots them on log-log axes using Recharts with scale="log".
App 2: MCID — Marine Corrosion Intelligence Database
Stack: React 19 · TypeScript · TanStack React Query · Recharts · Tailwind v4 Backend: FastAPI async (port 8202) · SQLAlchemy · SQLite (dev) / PostgreSQL (prod) Frontend: Vite dev server (port 5202) with /api → :8202 proxy
Pages
| Page | What it does |
|---|---|
| Fleet Overview | KPI stats (alerts, critical, warning, materials), low-thickness alerts table, corrosion-by-material chart, environment correlation chart, system info |
| Vessel Analysis | IMO search form, vessel info card, health score gauge (SVG arc), thickness statistics, component health breakdown bars, measurement summary |
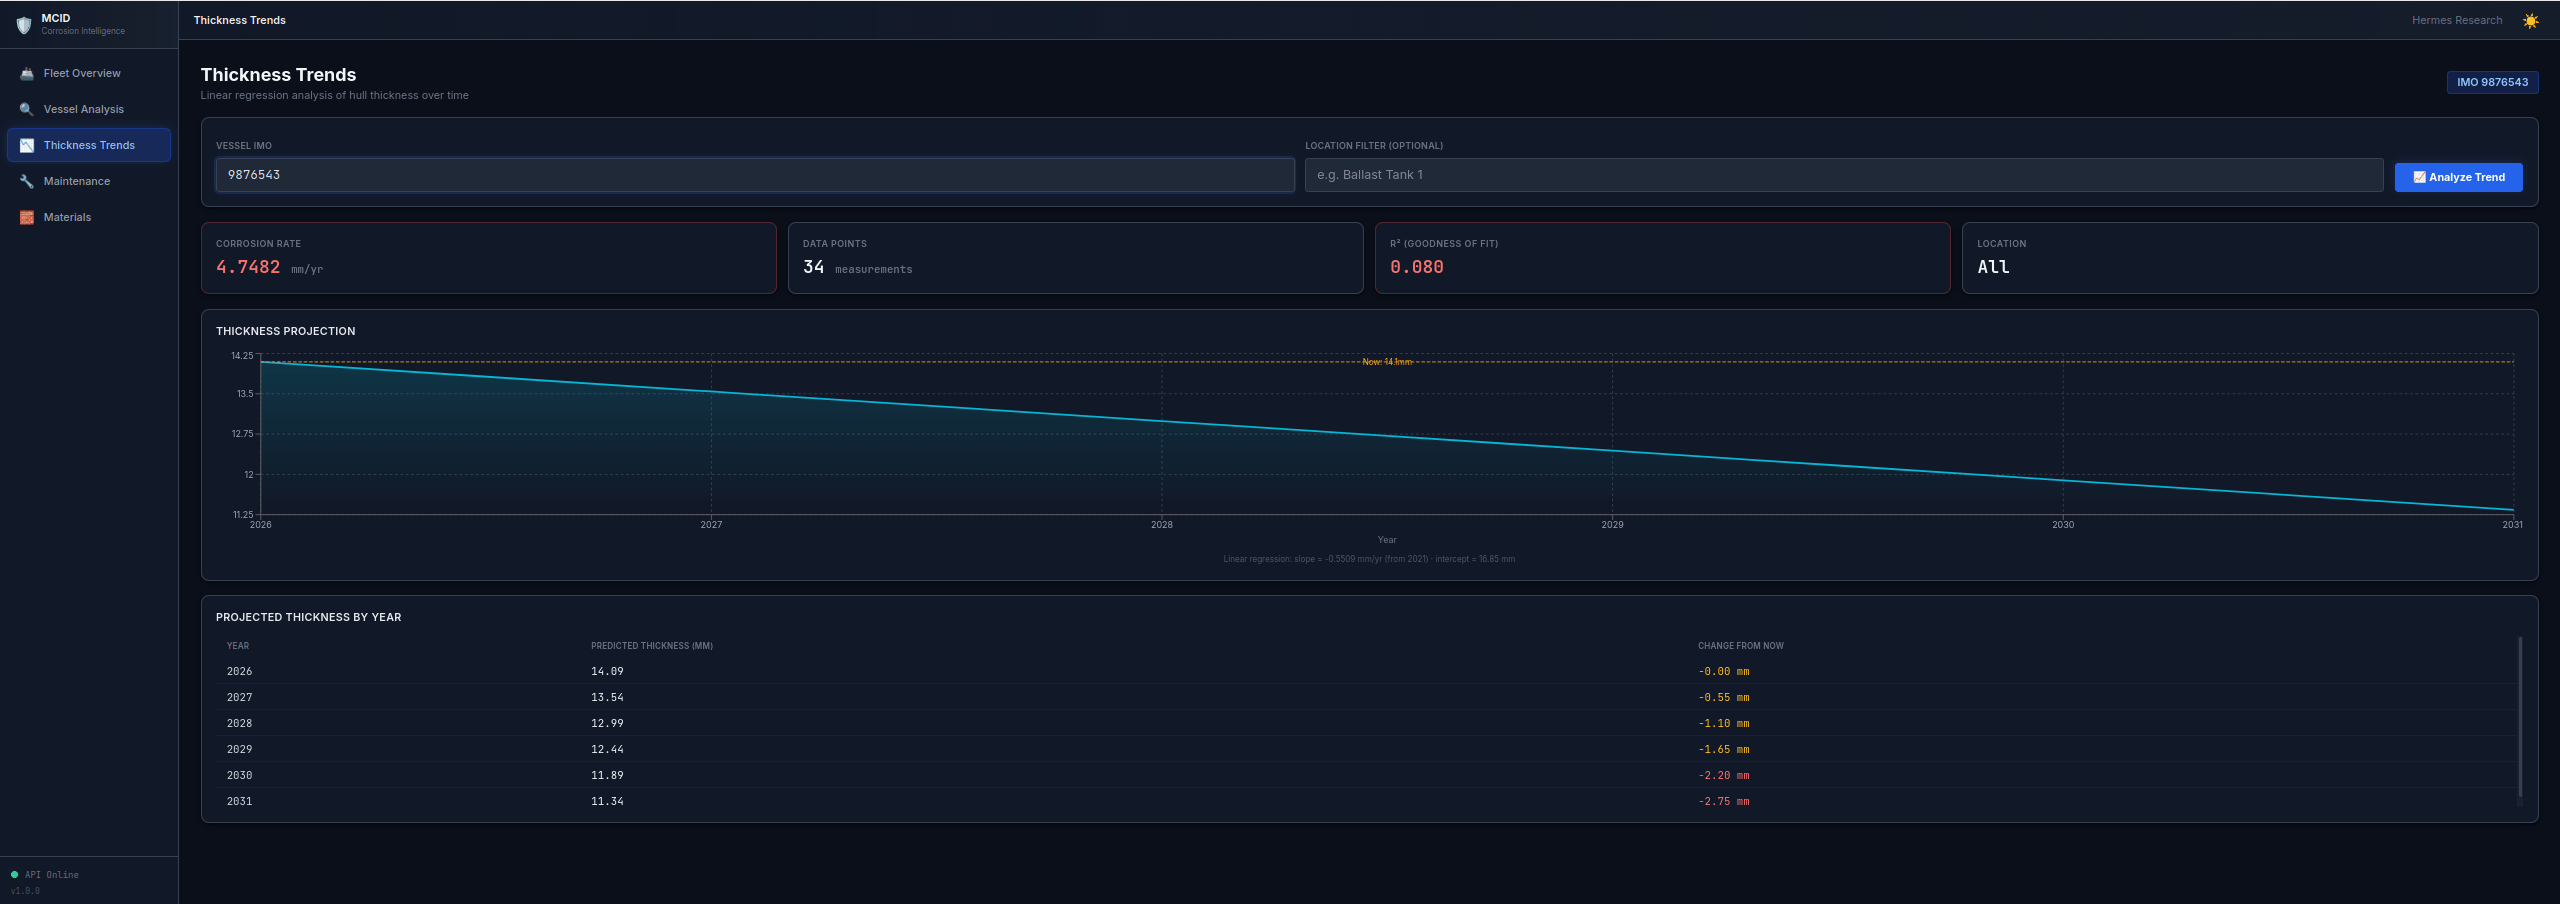
| Thickness Trends | IMO + location filter, corrosion rate/slope, R², projected thickness table, ThicknessTrendChart with linear regression projection |
| Maintenance | Next inspection prediction (date, interval, recommendation), RUL estimation with confidence |
| Materials | Sortable table, risk classification, corrosion rates horizontal bar chart, avg/min/max rates, sample counts |
Key Technical Decisions
Health score gauge is a custom SVG arc — the backend computes a 0–100 score from thickness ratio (0–40), corrosion rate (0–30), outlier percentage (0–15), and coating condition (0–15). The frontend renders it as a semi-circular gauge with color-coded status.
Linear regression for thickness trends is computed in the backend SQL query using OLS on inspection time-series data. The response includes slope_mm_yr, intercept_mm, r_squared, first_inspection_year, and a 6-year prediction array. The frontend ComposedChart (Area + ReferenceLine) renders the projection; the reference line is correctly positioned using intercept + slope × (currentYear − firstInspectionYear).
Cross-page IMO selection — when a user selects a vessel in Fleet Overview or enters an IMO in Vessel Analysis, it persists in React state and flows to Trends and Maintenance pages, so navigation doesn’t lose context.
API Contract Alignment: Lessons from the Interface Audit
A significant portion of development was spent auditing the backend API responses against the frontend TypeScript interfaces. Several mismatches were found and patched:
| Issue | Symptom | Fix |
|---|---|---|
material vs material_type | CorrosionRatesChart crashed — d.material_type is undefined | Backend query renamed field |
environment vs environment_type | EnvironmentCorrelationChart received undefined | Backend query renamed field |
count vs sample_count | TypeScript type expected sample_count | Backend field renamed |
corrosion_rate_mm_yr missing from trend top-level | TrendsPage stat crashed | Backend computed and added to response |
r_squared, slope_mm_yr, intercept_mm missing | Chart couldn’t render regression | Backend OLS computation added |
first_inspection_year missing | Reference line formula produced −1099 mm | Backend added to response |
confidence_interval Pydantic type too narrow | RUL endpoint returned 500 | Changed Dict[str, Optional[float]] → Dict[str, Any] |
Vessel model not imported in FastAPI endpoint | next-inspection returned 500 | Added import at module level |
The pattern: the UI TypeScript types were written first based on ideal API contracts, then the backend was patched to match. In future work, the API contracts should be defined first (e.g., via OpenAPI schemas) with the frontend generated or validated against them.
*How we built two production-grade React UIs on top of existing FastAPI backends — matching a shared design system, wiring up React Query, and integrating Recharts for real-time engineering visualization.