In 1980, the mobile offshore drilling unit Alexander L. Kielland capsized in the North Sea during a storm. One hundred and twenty-three people died. The formal investigation concluded that a fatigue crack in a brace end — a crack that had propagated from a weld toe over an estimated 10,000 to 100,000 load cycles — was the initiating failure. The structure had been designed to resist its maximum expected storm load. It did resist that load. What it could not resist was the accumulation of small stress cycles over years of wave loading — because nobody had designed against that.
This is not a historical curiosity. Fatigue-related failures in offshore structures have continued to occur at regular intervals across the industry. The Kielland capsizing is studied because it is well-documented and because the lesson it teaches is still routinely relearned: static strength is not the same as fatigue resistance.
The Difference That Matters
A static structural analysis answers one question: will this member yield or fracture when subjected to the maximum design load? It assumes the load is applied once, or a small number of times. An offshore structure is not subject to one load cycle. It is subject to millions.
Every wave passage applies a load cycle. A platform in 100m water depth might experience 10 million wave load cycles over a 20-year design life. The loads are within the elastic range — the structure never approaches its yield stress under normal conditions. But cyclic loading at stress levels well below yield, applied millions of times, produces crack initiation and propagation in welded steel. This is fatigue. The mechanism is completely different from static overload, and designing against it requires a completely different analytical approach.
The key variable in fatigue is not peak stress. It is stress range — the difference between the maximum and minimum stress in each cycle, denoted Δσ. A member stressed between 50 MPa and 100 MPa (Δσ = 50 MPa) accumulates fatigue damage at the same rate whether the mean stress is 50 MPa or 100 MPa. Mean stress affects the rate — tensile mean stress accelerates fatigue — but the primary driver is the range. This is counterintuitive for engineers trained on yield-based design.
Stress Concentrations: Where Cracks Start
In an ideal, smooth, unwelded steel member, fatigue life can be predicted with reasonable confidence from the applied stress range and the material’s fatigue limit — the stress range below which the member will survive effectively infinite cycles. For structural steel, this limit is approximately 10⁶ cycles at a stress range of around 50–60 MPa.
Real offshore structures are not smooth. Every weld creates a geometrical discontinuity. The weld toe — where the weld fusion line meets the parent plate — is a stress concentration. So is a web-to-flange fillet, a bolt hole, a bracket root, a cover plate termination. At these locations, the nominal stress is amplified by the geometry. The actual stress at the weld toe might be 2, 3, or 4 times the nominal stress calculated for the gross section.
This geometric sensitivity is why offshore structural fatigue design is not done with a single material fatigue curve. It is done with S-N curves that are specific to the joint detail — because the detail geometry determines the stress concentration factor, and the stress concentration determines the fatigue life.
The S-N Curve: Reading It Correctly
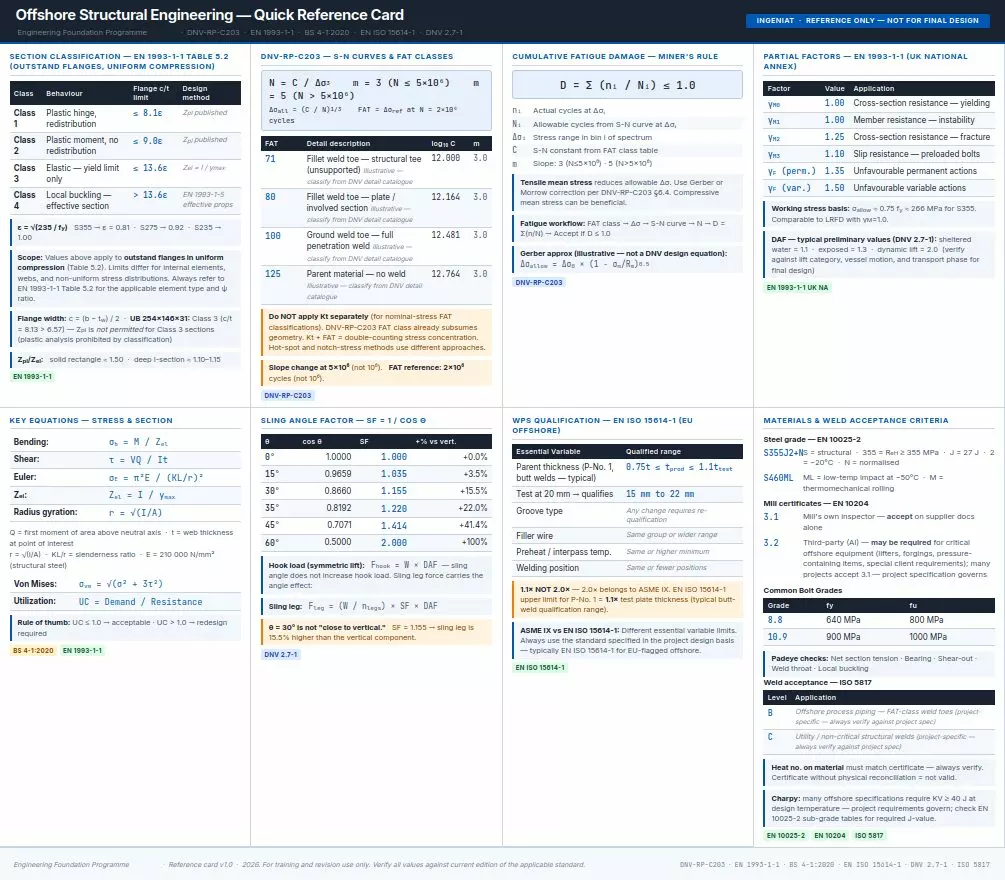
An S-N curve plots stress range (S) against the number of cycles to failure (N) on logarithmic axes. The slope of the curve tells you how quickly the allowable stress range drops as the required fatigue life increases. For offshore structural steel in the high-cycle regime (N > 10⁴), the slope is typically m = 3, meaning that doubling the required fatigue life reduces the allowable stress range by a factor of approximately 2^(-1/m) ≈ 0.79.
S-N curves for offshore fatigue design are published in classification society codes — principally DNV-RP-C203 in the North Sea context. The curves are indexed by FAT class — FAT 71, FAT 80, FAT 100, FAT 125. The FAT number is the reference stress range in megapascals, measured at a reference cycle count of 2×10⁶ cycles. FAT 71 is the most severe (lowest allowable stress range for a given cycle count); FAT 125 is the least severe — essentially the parent material fatigue limit for weld-free steel.
The detail geometry determines the FAT class. A fillet weld toe on a structural tee is FAT 71. A fillet weld toe on a plate edge is FAT 80. A ground and profiled full-penetration weld toe is FAT 100. Parent material is FAT 125. The difference between FAT 80 and FAT 100 at N = 10⁶ cycles is not trivial: FAT 80 allows approximately 107 MPa; FAT 100 allows approximately 134 MPa. Choosing the wrong FAT class — assigning FAT 100 to a detail that is actually FAT 80 — makes your fatigue assessment look significantly less conservative than it actually is.
Request our complimentary Structural Engineering Reference Card
What Codes Assume About Welds
Here is the part that most engineers find surprising: design codes such as DNV-RP-C203 do not design against crack initiation. They design against crack propagation. They assume that a crack-like flaw already exists at the weld toe at the start of the design life.
This is a deliberate, conservative assumption. It removes the unpredictable initiation phase — which depends on weld quality, residual stress, surface condition, and environmental factors — and designs directly against the growth of an existing flaw. The S-N curve fatigue life is not the cycles to first form a crack. It is the cycles to grow a crack from an initial flaw to a critical size.
What this means in practice: a weld that looks sound, that passes visual inspection and ultrasonic testing, may still be assumed to contain a flaw of detectable size at the weld toe. The fatigue assessment is based on that assumption, not on the assumption of a perfect weld.
The Implication for Design Engineers
Fatigue design is not a check you apply at the end of a structural analysis. It is a consideration that affects member proportioning, joint geometry, weld detail selection, and fabrication quality requirements from the earliest stages of design. The detail you choose — the geometry of the connection, the weld toe profile, whether you grind and inspect the weld toe — determines your FAT class, which determines your allowable stress range, which determines whether your member passes or fails the fatigue check.
This is why offshore structural engineers spend as much time on connection details as on member sizing. The member is usually fine. The connection is where the work is.
If you work in offshore structural design and have not had the FAT class system, the S-N curve selection logic, and the cumulative damage rules explained from first principles — with the code in your hand — there are gaps in your baseline that will surface on the job, not in the abstract. The good news is that these are learnable. The Kielland inquiry noted that the fatigue crack had been detectable by inspection before the failure. The lesson was not just about loading. It was about whether the people reviewing the structure understood what they were looking at.
Find out more, fill in your contact details below and we will come back to you as soon as possible.