A CII gap analysis is a structured, forward-looking assessment of whether a vessel’s operational carbon intensity trajectory will remain within required rating thresholds under MARPOL Annex VI’s tightening regulatory framework. It is not a one-time compliance check but a dynamic management tool that must evolve alongside both regulatory developments and a vessel’s changing operational and technical condition.
What Our Services Cover
Applicable to vessels of 5,000 GT and above on international voyages, our services begin with a precise reconstruction of historical carbon intensity performance using verified fuel consumption data, voyage distances, and transport work metrics aligned with IMO Data Collection System requirements. This establishes the vessel’s attained Annual Efficiency Ratio (AER) and identifies the key drivers of rating variability — including ballast ratios, speed profiles, port idle time, cargo utilization, and seasonal trade patterns. Understanding this variability is essential because CII is operationally sensitive; a vessel in sound technical condition can still experience significant rating fluctuation due to the nature of its commercial deployment.
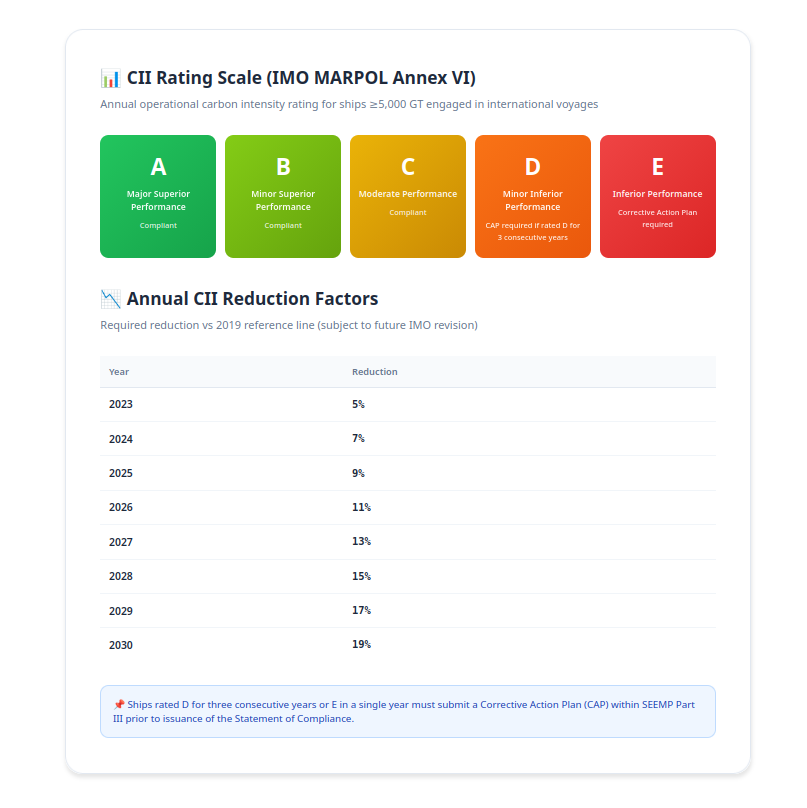
Historical performance is then overlaid against the IMO’s annual reduction trajectory, projected across a three-to-five-year forward horizon. Because regulatory thresholds tighten each year relative to the 2019 reference baseline, a vessel’s rating can deteriorate even if its actual emissions profile remains unchanged. The “gap” — the quantitative difference between projected attained CII and the required threshold — is assessed not just as a binary compliant/non-compliant outcome, but as a probability distribution across rating bands. This distinction matters because three consecutive D ratings or a single E rating triggers a mandatory Corrective Action Plan (CAP) under SEEMP Part III, with potential consequences for vessel insurability, charterparty negotiations, and port state perception.
Our services include detailed sensitivity modelling across a range of stress scenarios, examining how variables such as speed changes, reduced cargo utilization, extended ballast voyages, and hull fouling progression affect the attained AER. Critically, our analysis integrates engineering performance baselines and dry-docking schedules into the forward model, since incremental efficiency losses from hull resistance growth, propeller degradation, and engine wear can quietly erode a vessel’s rating margin over time. A vessel comfortably rated C today may migrate toward D territory within two to three years through the compounding effect of technical deterioration and regulatory tightening alone. Charterparty terms and trade route constraints are also assessed, as these can significantly limit the operational flexibility available to owners and managers seeking to optimize performance.
Outputs and Deliverables
Our gap analysis produces a comprehensive set of actionable outputs:
- A multi-year rating forecast under both base-case and stress-case scenarios, giving owners and managers a clear view of compliance risk across the planning horizon
- Identification of the specific year in which D or E rating risk becomes material, enabling proactive intervention rather than reactive correction
- Quantification of the emissions reductions required to restore or maintain a C rating or above
- A structured evaluation of corrective measures, spanning operational interventions such as speed optimization and improved voyage planning, through to technical retrofits including energy-saving devices, propeller upgrades, and waste heat recovery systems, as well as fuel switching strategies where applicable
- Assessment of each measure’s impact magnitude, implementation timeline, capital cost, and interaction with broader regulatory exposures such as regional carbon pricing mechanisms
Annual Reduction Trajectory (vs 2019 Reference Line):
(*) Note: Reduction factors are subject to potential revision under the IMO 2023 GHG Strategy.
Strategic Value
A well-executed CII gap analysis serves three functions simultaneously. It protects regulatory compliance by identifying CAP trigger risk early and providing the lead time needed to implement corrective action. It supports commercial positioning by enabling informed charter negotiations, deployment planning, and transparent dialogue with charterers who increasingly scrutinize vessel environmental credentials. And it informs capital allocation decisions by quantifying the economic justification for efficiency investments, ensuring that expenditure is directed where it will have the greatest impact on rating performance and long-term fleet value.
Because CII reduction factors are subject to potential revision under evolving IMO climate strategy, and because a vessel’s operational and technical profile changes continuously, our services are designed to be refreshed at least annually and integrated into fleet performance monitoring as an ongoing capability — not a one-off exercise.
What we do: We provide comprehensive CII gap analysis and CAP development services:
A. Current CII Assessment
- Historical CII calculation and verification
- Rating projection for current year
- Benchmarking against fleet type peers
B. Gap Analysis
- Identify performance shortfalls vs. required rating
- Quantify CO2 reduction needed
- Prioritize improvement measures by impact
C. Corrective Action Plan Development
- Short-term operational improvements
- Medium-term technical modifications
- Long-term strategic option
D. CAP Implementation Support
- Step-by-step implementation roadmap
- Monitoring and tracking framework
- Annual review and adjustment
Is your fleet prepared for the 2026 CII deadline?