
For CSOs, ESG/sustainability managers, and compliance officers evaluating fleet-level water, waste, and emissions reporting.
The first sentence of Ingeniat’s overview of vacuum-based waste collection calls out “minimizing water usage” as a leading advantage. That advantage has direct sustainability-reporting value and an indirect — but quantifiable — emissions value through freshwater production. This post works through the chain carefully and honestly, including where the regulatory and reporting links are direct, where they are indirect, and where the numbers get modest.
The freshwater → fuel → emissions chain
Vacuum toilets flush with 0.5–1.2 L versus 4–6 L for a gravity marine toilet. That 3–5 L of saved freshwater per flush is freshwater the ship does not have to make.
Marine freshwater is not free. It is produced from seawater by:
- Reverse osmosis (RO) — electric-driven, typically 3–6 kWh per m³ of product water, depending on feed salinity and system efficiency.
- Thermal evaporation — heat-driven (often waste-heat from the auxiliary engines), significantly more energy-intensive than RO per m³.
Every cubic metre of freshwater the ship does not produce is energy the auxiliary engines do not consume, and therefore fuel not burned and emissions not emitted.
Worked example — a 2,000-passenger cruise ship
Inputs (mid-range conservative figures):
| Variable | Value |
|---|---|
| Passengers | 2,000 |
| Toilet uses per person per day | 6 |
| Water saved per flush (vacuum vs. gravity) | 4 L |
| Freshwater saved per day | 48,000 L (48 m³) |
| Voyages per year | 50 |
| Voyage length | 7 days |
| Annual freshwater saved | ~16,800 m³ |
Now the indirect emissions impact. Assuming a mid-efficiency RO plant at ~5 kWh/m³:
- Electrical energy saved: 16,800 m³ × 5 kWh/m³ = ~84,000 kWh/year
- Auxiliary-engine fuel equivalent (HFO at ~0.24 kg/kWh electric): ~20 tonnes HFO/year
- CO₂ emissions avoided (IMO emission factor for HFO: 3.114 t CO₂/t fuel): ~62 tonnes CO₂/year
Translated into compliance economics at an illustrative €80/t CO₂ EU Allowance price:
- 2024 EU ETS phase-in (40% scope, intra-EU voyages): ~€2,000 in EUA value
- 2025 (70%): ~€3,500
- 2026 onward (100% scope, all EU voyages, plus CH₄/N₂O): ~€5,000
Replace the EUA price, fuel factor, and RO energy intensity with your fleet’s actual figures before quoting in a real engagement. The figure scales linearly: doubling the voyage count or doubling the freshwater savings doubles the result.
The blackwater concentration benefit
Less flush water per use means more concentrated blackwater downstream. Two practical consequences:
- Smaller holding tanks for the same holding-time compliance, or longer holding time for the same tank volume — useful in special-area discharge regimes (Baltic, North Sea, Antarctic, Polar) where MARPOL Annex IV restricts or prohibits discharge.
- Easier STP loading — sewage treatment plants are sized on hydraulic load; reducing dilution water reduces hydraulic load and lets a smaller plant handle the same organic load.
This is a direct compliance and design benefit, independent of the freshwater → emissions chain.
Regulatory touchpoints — direct and indirect
Direct:
- MARPOL Annex IV — the international convention regulating sewage discharge from ships. Vacuum collection does not change Annex IV’s requirements, but its concentrated blackwater simplifies holding-tank and STP design to meet them.
Indirect — via freshwater-production energy:
- EU ETS for maritime — covers CO₂ emissions from fuel combustion on voyages (40% in 2024, 70% in 2025, 100% from 2026, plus CH₄ and N₂O from 2026). Vacuum systems reduce auxiliary-engine fuel use; the saving flows into the voyage emissions balance and EUA surrender obligation. Verify current scope and phase-in against the EU MRV regulation before any specific claim.
- FuelEU Maritime — operational GHG intensity of energy used by ships, with progressive reduction targets from 2025. Auxiliary engines are part of the in-scope energy mix. Same indirect logic applies.
- IMO MARPOL Annex VI / CII rating — operational carbon intensity indicator for individual ships, graded A–E. Auxiliary energy reduction contributes to a better CII trajectory.
The honest framing: none of these regulations target waste handling directly. The link to ETS, FuelEU, and CII runs through freshwater-production energy. That link is real but modest per ship. The reporting and reputational value is often larger than the pure compliance value.
Reporting angle
For ESG disclosures and industry frameworks:
- Sea Cargo Charter — annual CO₂ emissions reporting aligned with IMO’s Data Collection System. Auxiliary reductions are reportable.
- Poseidon Principles — for finance-side reporting of climate alignment; same DCS-based methodology.
- Internal ESG reporting — freshwater consumption per passenger-night is a meaningful KPI for cruise and ferry operators; vacuum systems offer a measurable reduction that survives scrutiny.
- Sustainability narrative for stakeholders — credible because the chain is traceable: litres saved → energy saved → fuel saved → emissions avoided.
Honest limits
A few caveats worth stating plainly before this case goes into a board paper:
- The per-ship savings are modest. The €5,000/year EU ETS number above is real but small against a multi-million-euro annual EUA bill. The case strengthens at fleet scale, not per-vessel.
- Vacuum does not reduce main propulsion emissions. The story is auxiliary-engine fuel, which is a fraction of total voyage fuel.
- The freshwater→emissions chain depends on the ship’s actual freshwater plant. A ship with an efficient RO at 3 kWh/m³ gets a smaller number than one with a thermal evaporator at 12 kWh/m³. Use the real plant spec, not the rule of thumb.
- Sustainability claims need traceability. A figure like “62 t CO₂/year saved” survives audit only if the freshwater savings, plant efficiency, and fuel factor are documented. Otherwise it is marketing, not reporting.
Where this leads
For CSOs and sustainability teams evaluating the case for their fleet, the next step is a per-vessel calculator that uses the actual freshwater plant, fixture count, and operating profile. The output is a defensible line in the next ESG report — not a sales-deck talking point.
Ingeniat’s overview is the engineering entry point; the sustainability case is what you build on top of them with your own operational data.
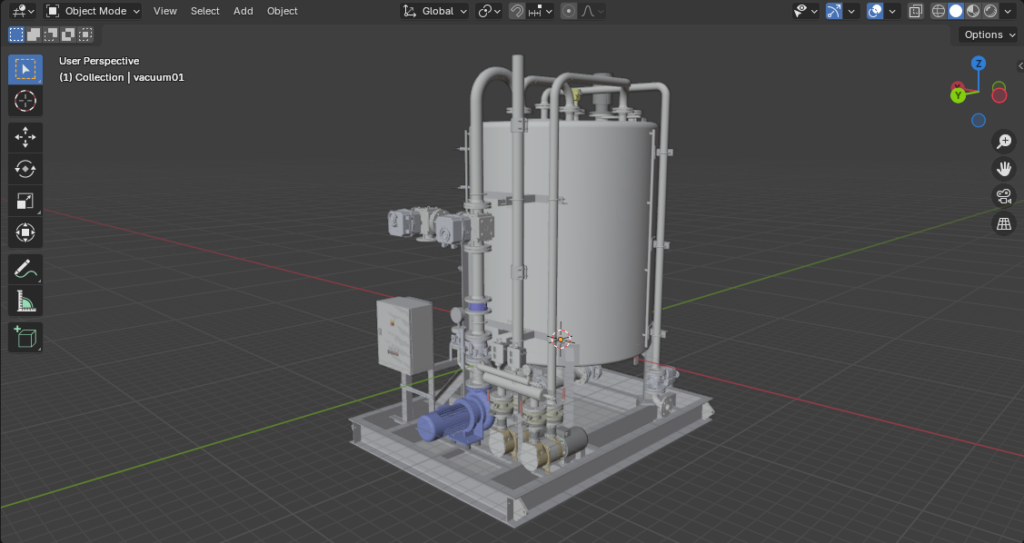
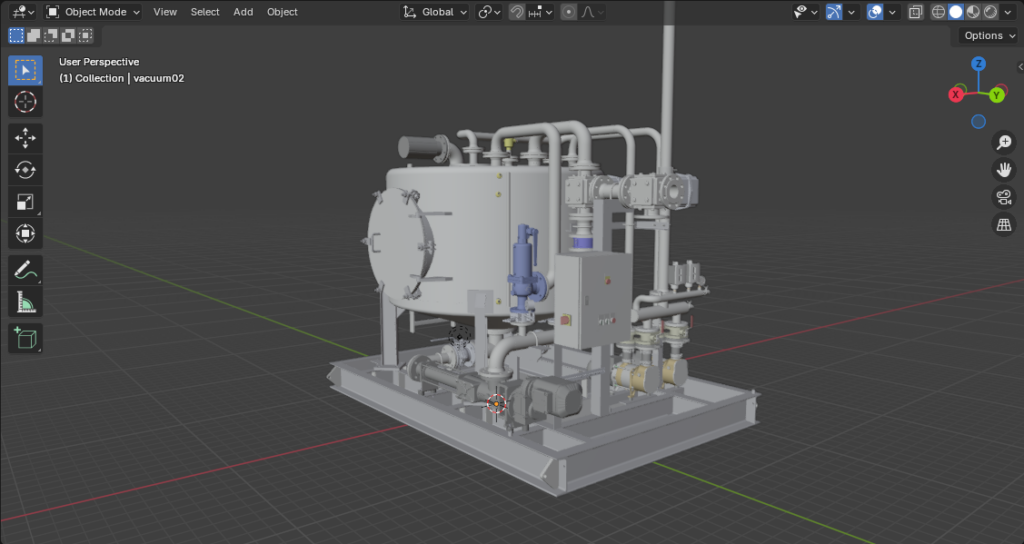
Vacuum-based waste collection systems are commonly used on a variety of ships, including cruise ships, ferries, naval vessels, and large commercial vessels. They are particularly advantageous in ships where minimizing water usage and maintaining high hygiene standards are critical, such as passenger ships and offshore platforms. Further information regarding the installation of vacuum-based waste collection systems can be found through the following link.